Understanding your profitability picture (with FREE worksheet)

Although Cash flow is used in business every day, most business people use these terms to describe general availability of cash: “We need to improve our cash flow!” or “I need more cash flow”.
To a banker though, or any investor, cash flow has specific value. It is a ratio that determines your ability to serve your debt. It is a ratio that describes your management competence. So you, as a business leader, need to understand this – otherwise money people will always take advantage of you. For more on this, please download our ebook How to double your cash flow overnight
We want to teach you how to uncover your full cash flow picture so you can take control of your business before someone else does. We will be looking at the process you will need to follow to fully understand your cash flow picture. Below are the key steps you will need to take:
#1 Identify if your cash flow is inadequate (Find out here)
#2 Understanding your Profitability picture
#3 Understanding your Working Capital picture
#4 Understanding your other assets and investments
#5 Understanding your Funding
In this blog we will look closely into step 2 understanding your profitability picture and how to uncover this.
Profit is the first thing that happens in your business, so it is important to understand your Profitability picture. This area consists of a number of tasks:
Task 1
What is your revenue and how has it changed year on year? Take your annual P&L for the last 2-3 years and look at your revenue. Work out the percentage change between years. What are the numbers telling you? Are your growing and if yes by how much, in percentage terms.
Task 2
What is your gross margin and how has it changed year on year? Take your annual P&L for the last 2-3 years and look at your gross margin in terms of percentage and how has it changed over the years. Is it growing or shrinking?
Task 3
What are your overheads and how are they changing year on year? What has contributed to this?
Task 4
What is your EBIT and Net profit in percentage terms and how are they changing year on year.
Task 5
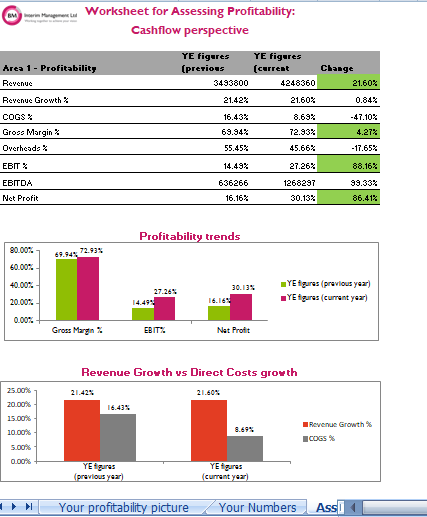
Look at your profitability trends. Present the movement in Gross margin, EBIT and Net profit visually, in a graph, so you can see how they have moved over the 2-3 year period. What is that telling you? Do you need to make some changes in your business, or is what you are doing working for you and your business?
Task 6
Compare your revenue growth with your direct costs changes. Again, plot the data in a graph, to be able to visualise the change. If you can see that the variance between the two is widening, than keep doing whatever you are already doing.
Task 7
Compare the revenue growth with your overheads changes. Present these trends visually, in a graph to be able to see more clearly how they are changing in relation to one another. Widening the gap between the two is a good sign. Keep doing whatever you are doing.
> Access your Profitability worksheet here! <
So the key numbers that will tell you if your profitability is healthy are the changes in revenue, the changes in gross margin, the changes in EBIT and the changes in Net profit. Present the data in percentages to be able to extract more meaningful information from the analysis.
If you are not satisfied with what you see, then the best way to go about this is to set the profitability profile you aspire to for your business and set a plan of how to get there.
All of this might sound overwhelming to you. Don’t worry, we have made it easy for you to achieve healthier profitability picture. We have created a worksheet to help you assess this in minutes, so you can focus your attention on the improvements and growth. Go ahead, download the worksheet here.
What is YOUR profitability picture? Let us know by dropping us an email
> Access your Profitability worksheet here! <
RELATED LINKS
Read more about BMIM Cash flow
How we measure the success of your Strategy (WITH FREE TOOL)
How to fix your Working Capital problem…even if you are not “numbers person”?
Turnover is vanity, Profit is sanity – but Cash flow is reality!
How to generate cash to self-finance your business?
Life-Cycle Financing of your Entrepreneurial Company
Early stage business financing: The pros and cons of taking money from Business Angels
Case Study: Growing broke with inadequate cash flow
Case Study: Financial turnaround and re-invention
Case Study: Restructuring for Survival and Financial Turnaround